
Qui di seguito lo studio che ha ottenuto il riconoscimento di miglior poster tra quelli presentati nel corso del Convegno “La previsione idrogeologica della risorsa acqua” dalla Accademia Nazionale dei Lincei.
1-INTRODUCTION
Lakes are large and important surface fresh water reserves suitable for drinking, tourism, cultural, agricultural and productive uses. Lakes belong to the wide hydrological and hydrogeological basins whose potential recharge is strictly related to precipitations and infiltration processes. For these reasons, it is fundamental to manage a correct sustainable use of freshwater resources taking into account not only the amount of the whole available water volume, but also the system’s response to the rainfalls oscillations, hydrological and hydrogeological response, evaporation processes and water supply captions. The 2017 year, has recorded a thermometric anomaly of +1,3°C with a deficit of over 30% of rainfall. Furthermore, human water supply do not usually take into account the above climate changes. As result of water supply, evaporation and rainfall deficit, the Bracciano Lake water level is currently lowering and the whole lacustrine ecosystem is in a very unstable state of equilibrium. The purpose of this work is to underline how the Lake Bracciano case could do school, at national and international level, with the awareness that the value of water resources with its anthropic uses and the numerous ecosystem services that it expresses, must encourage a careful and conscious use of water.
2-STUDY AREA
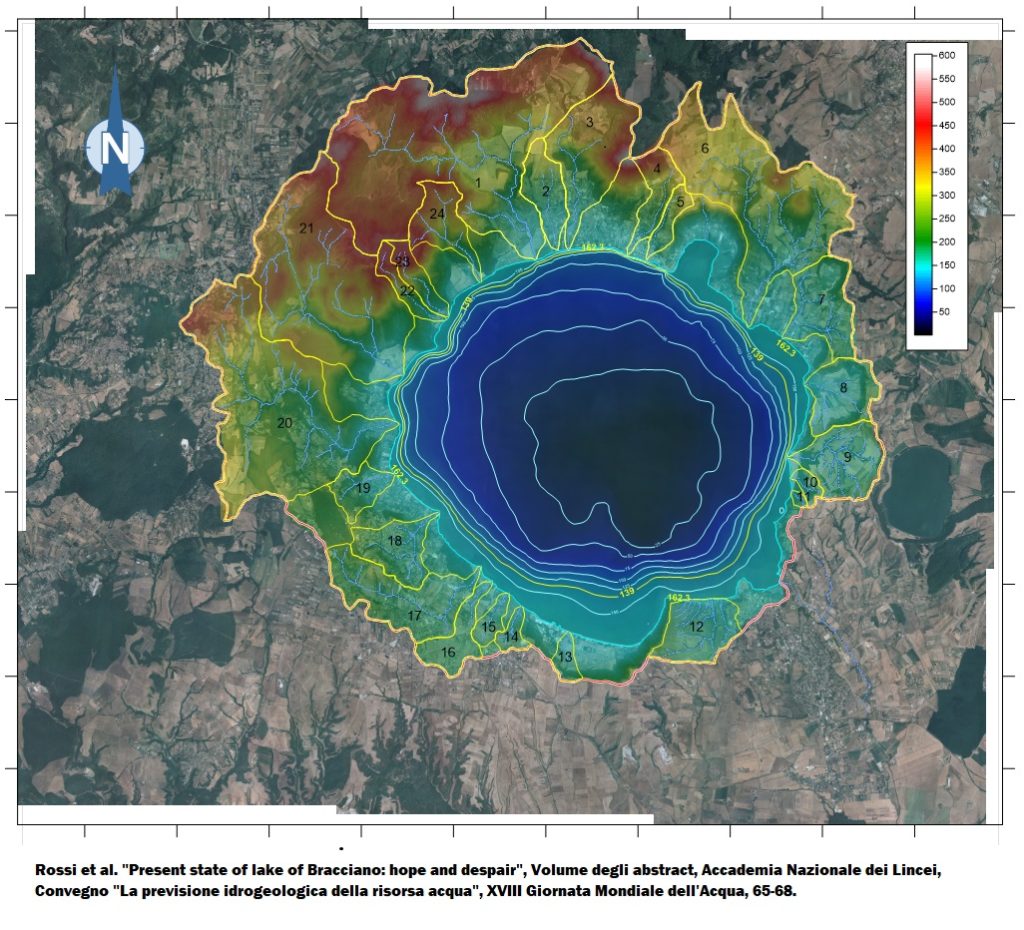
Lake Bracciano is a sub-circular volcanic lake (Shoreline Development, SL = 1.2) located 32-km Northwest of Rome (Latium, Italy), belonging the Sabatino Volcanic District, characterized by trachytic and phonolitic products. It has 57.680 km2 of surface area and a circular perimeter of 31.981 km. Its elevation is 163.04 m a.s.l. (altitude of the Arrone River emissary, here considered as hydrometric zero of the lake) with a maximum depth of 165 m (Fig. 1). The Lake is characterized by a modest catchment area 147.483km2 mainly composed by 24 sub-basin with different shape and dimensions (Fig.1). Within the catchment, there are neither springs nor rivers that bring water into the lake. Despite the total amount of the surface available for runoff and rainfalls the Lake occupies 40% of the whole catchment surface, with an hydrogeological basin slightly larger. These last aspects make the Lake Bracciano particularly sensitive to climatic variations (Taviani & Henriksen, 2015). The lake is oligo-mesotrophic (Rossi et al. 2010; Costantini et al. 2012) and is used as a drinking water reservoir for the city of Rome and the Vatican State.
3-MATERIAL AND METHODS
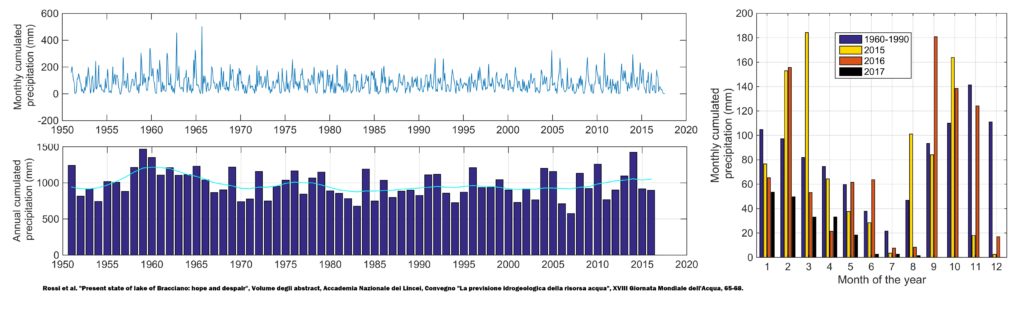
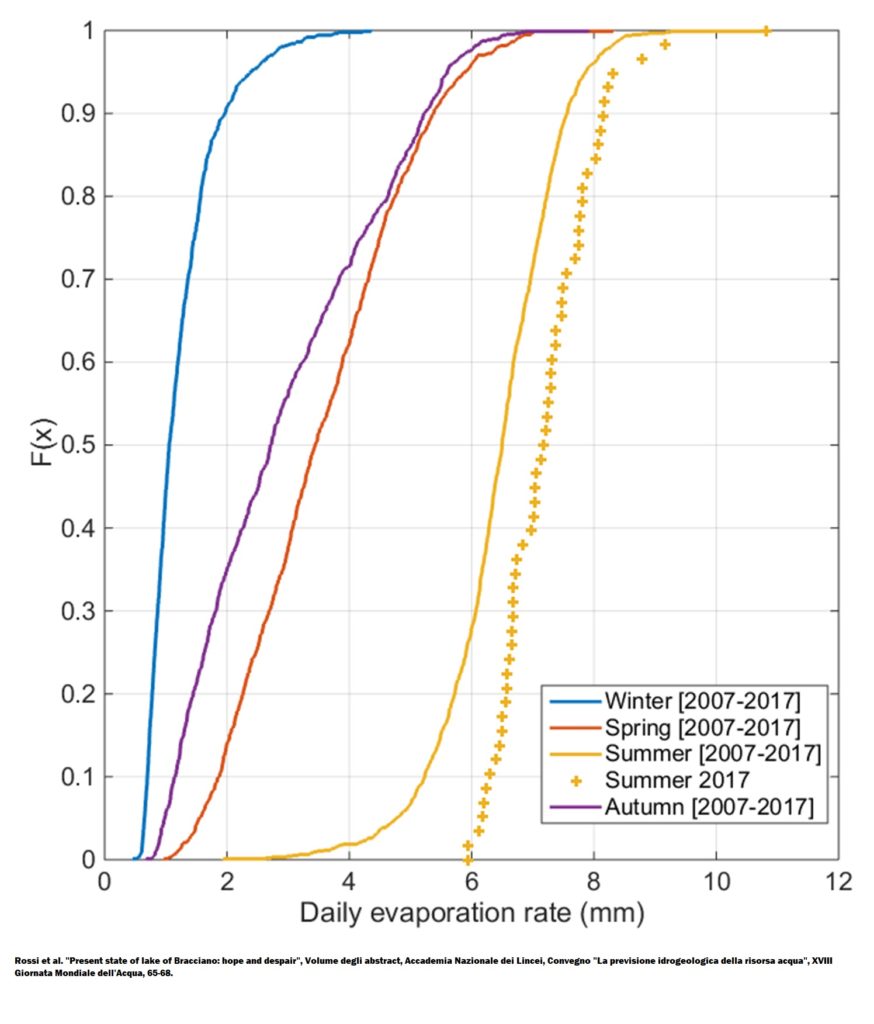
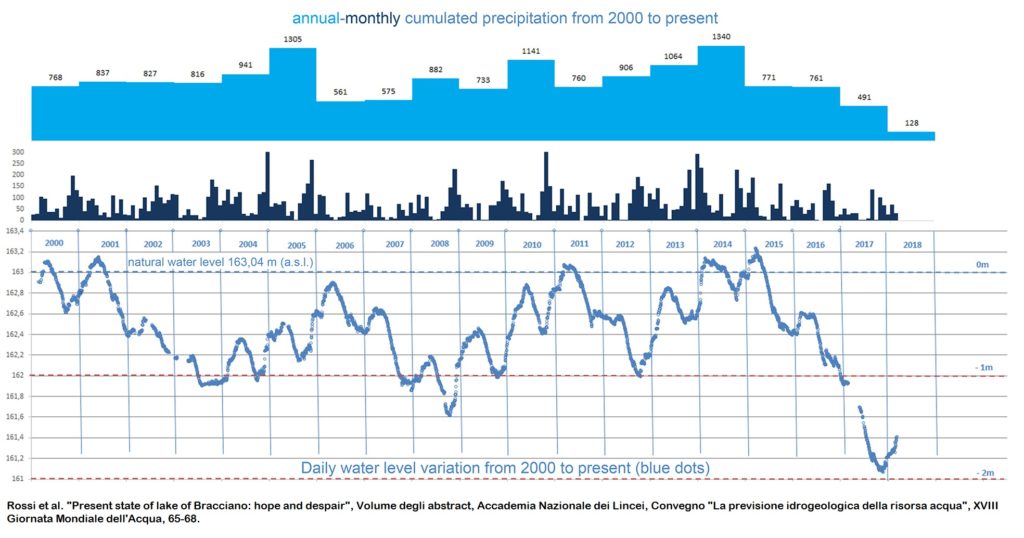
High resolution aerial photo analyses and field campaigns GPS Data were used to assess the coastal line variation, compared to the relative water level oscillation. Daily hydrometer field data (Bracciano, Trevignano and Aguillara piers hydrometers), were used to evaluate the time water level variation. A detailed Digital Elevation Model and a new and up-to-date digital bathymetry were realized to quantify the amount of surface loss/increase of the lake floor. Specific 3D software were used to model the morphology of the lake water floor and to evaluate surfaces and volumes losses (Fig. 1). Penman’s combined heat balance and aerodynamic equation (Penman, 1948; Penman, 1956) was used to estimate evaporation from the lake Bracciano open water surface on the basis of the climate data measured at the site, Vigna di Valle “dati/prodotti meteo del Servizio Meteorologico dell’Aeronautica Militare” (with the exception of downward solar radiation taken from ERA interim reanalysis (Dee et al. 2011), using the modified wind function adopted by Linacre (1993). Short wave reflectivity and emissivity coefficients of the water surface as well as longwave radiation coefficients for clear skies were estimated following Shuttleworth (1993). Rainfall analysis from 1950 to present has been carried out to estimate the impact of rainfall within the lake catchment area (Fig. 2) (Romano & Preziosi, 2013; Romano et al. 2017).
 4-RESULTS AND DISCUSSION
The lake water level changes recorded in the last years (from 2000 to present), leave no doubts about the significant advancement of the shoreline (100m maximum at the end of 2017 Year with respect to April 2017). The reconstruction of the digital model of the lake cuvette (Fig. 1) has allowed quantifying the effects of the lake level oscillations on the shoreline location (Table). The maximum sustainable level evaluated in literature fixed at -150cm, equal to 13.4% of the surface area used for the self-purification processes, was exceeded. This value had to represent the minimum equilibrium limit that the lake ecosystem of Bracciano could sustain (Rossi, 2006). On November 2017 the Lake level reached its historical low of -198cm. Such a lowering exposes the lake system to significant risks with a loss of self-purification surface evaluated in -22.5% of loss.
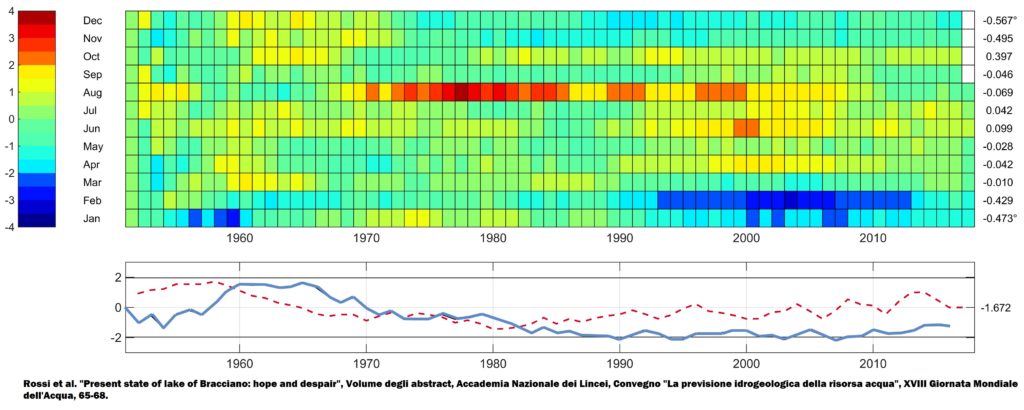
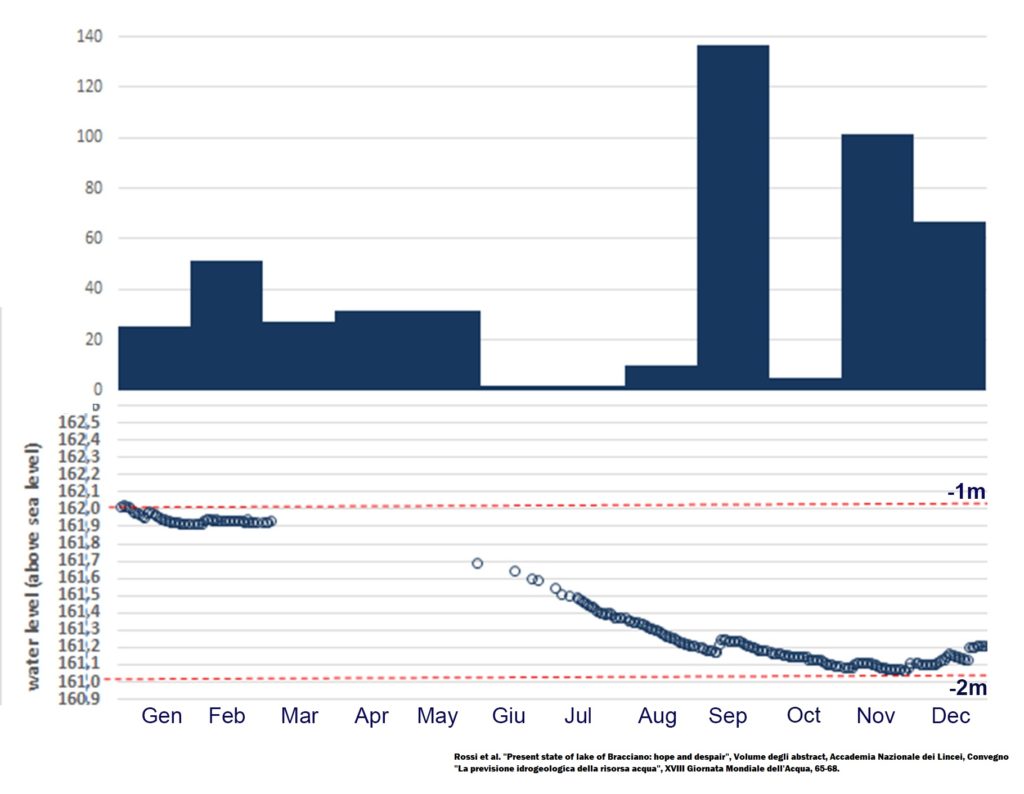 The multitemporal analysis of the water table oscillation (Figg. 3-5), rainfall, evaporation (Fig.4) and human water supply, allow us to evaluate the shoreline changes and to estimate the water loss/increase volumes during the time interval. Despite the natural water level changes recordered in the last decade, the 2017 year represents one of the most anomalous ever, with a water surface loss of 2km2. Water level variation, measured during 2017 Year, compared with the last 17 years shows how the water level decrease is particularly evident in the last three years. Despite the average water level decrease during the summer season (data from 2000 to 2015) range from 50 to 60cm, a partial or total recovery of water level has always been recorded, except for 2015-2017 interval. The rate of water loss during summer seasons does not change in the last 17 Years (Fig. 5), showing always the same decreasing rate. The 2015/2017 Years show 80cm decrease during 2015, 60cm during 2016 and 100cm in 2017, with only 20cm of water level recovery during 2016 winter, with 114Mm3 of volume loss. The absence of the recovery phase during winter 2016/2017 represents one of the main causes of the anomalous decrease of water level. Furthermore rainfall deficit (Lake Bracciano area approximately -50%; -30% at national scale for the 2017), evaporation rates ranging from 6.4 to 7.3mm/day during the summer season (for the ten years baseline 2007-2017, annual average 3.6mm/day in the last 10 years), and human water supply contribute substantially to the progressive lowering of the water level.
 5-CONCLUSIONS
The scarces precipitations, the intense evaporation processes (6.4mm/day to 7.3mm/day), and the withdrawals have brought the lake Bracciano in a serious stress condition during 2017 due to the maximum observed reduction from hydrometric zero (163,04m s.l.m.) of approximately -200 cm, corresponding to 2km2 water surface loss. The lowest value measured on November 2017 (-198cm), exposes to significant risks the lacustrine system that needs a careful assessment of the state of health, to further improving the knowledge related to the environmental weaknesses. Despite all, the Lake Bracciano crisis seems to have started since 2015. In the last three years, no recovery levels was measured due to the scarse precipitation, the intense evaporation and human withdrawals, with a total water level loss evaluated into -2,14m from hydrometric zero. The above mentioned trend seems to be easily predictable, if more attention to climatic and natural lake behaviour had been taken into account properly and in time. If the 2017 climatic anomaly should happen again we will face a unique water crisis with a possible water volume loss for Lake Bracciano valuable to 170Mm3, with 2.7km2 of lake bottom loss.
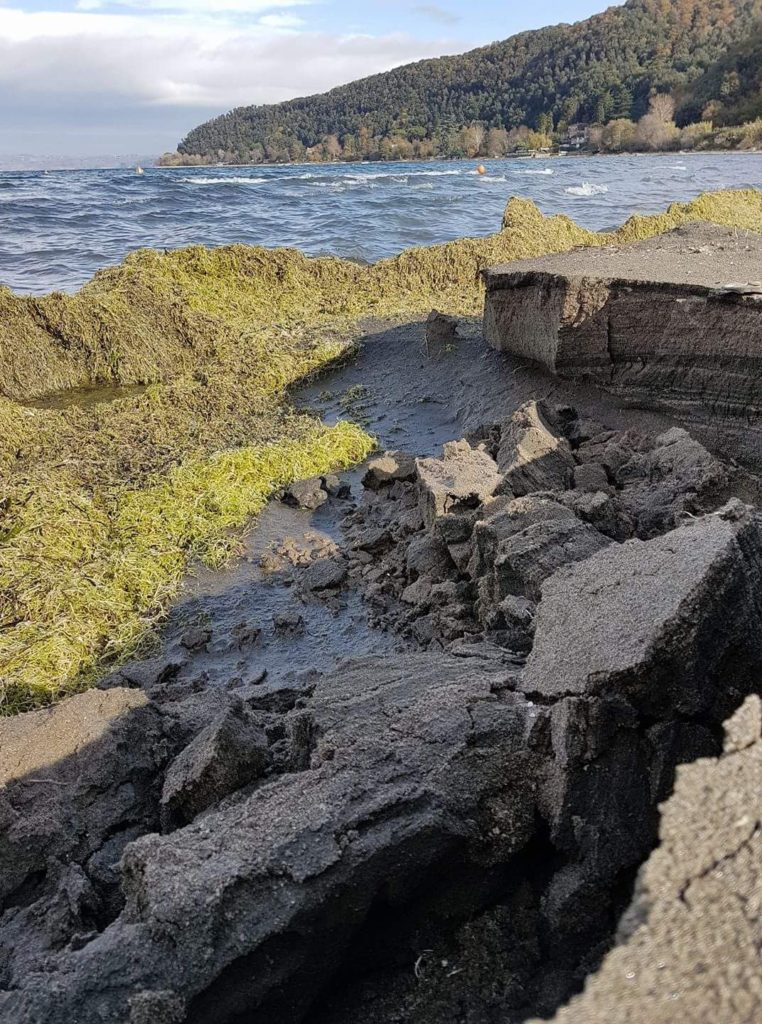
Fig. 6 – Comparison between shoreline trend from 2008 to present using field photos (to the left) and GPS field analyses (to the right). Each single line (different colours) represent the trend of the lake shoreline in different period
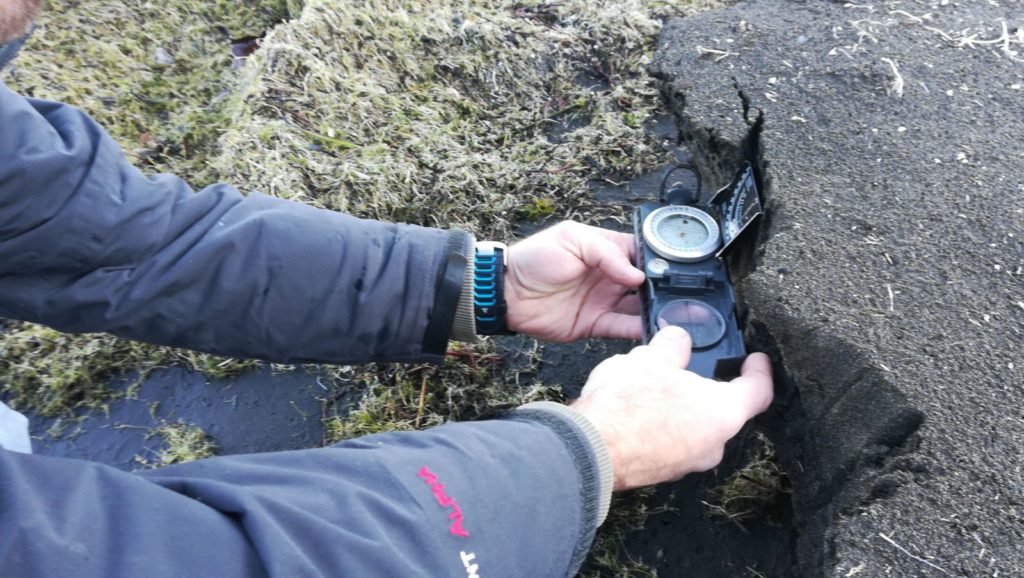
Fig. 6 – Comparison between shoreline trend from 2008 to present using field photos (to the left) and GPS field analyses (to the right). Each single line (different colours) represent the trend of the lake shoreline in different period
ARTICOLO DI DAVID ROSSI / CREDITS DAVID ROSSI, Emanuele Romano, Nicolas Guyennon, Stefano Ghergo, Daniele Parrone, Martina Rainaldi, Alessandro Mecali (IRSA- CNR, Monterotondo) – Emanuele Perugini (Bracciano Smart Lake) – Antonio Scala (ISC_CNR) – Sara Taviani (Università di Milano-Bicocca)
Commenti recenti